
Filiberto Penados[1]
Galen University
Lynmara Rosado[2]
Galen University
Delmer Tzib[3]
University of Belize
Joy Lee-Shi[4]
St. John’s College University
Gwen Nunez Gonzalez[5]
University of Belize
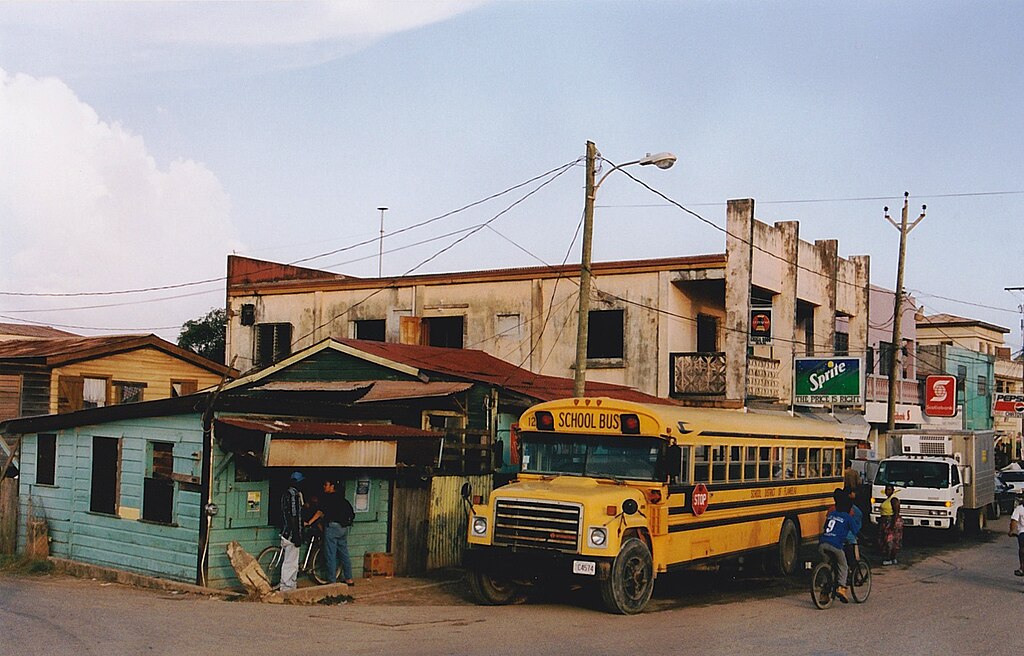
School bus, The Price Is Right, Scotia Bank, Belize. Jasmine Halki, 2014.
CC BY 2.0. https://commons.wikimedia.org/w/index.php?curid=81356777
Abstract / Resumen
The number of Belizeans with a higher education according to the 2018 population census stands at 14%. In sharp contrast, indigenous Maya people with a higher education are reported at 5.6%, and in yet another contrast the Garifuna people, another Indigenous report 20.1%. What explains these contrasts? Why do they matter? What are the implications for Higher Education Policy and practice? This article addresses these questions by examining Indigenous Participation in higher education in Belize in light of Higher Education seen as a vehicle for personal realization, achieving greater human and economic development, overcoming social and economic inequality and contributing to greater understanding across cultures.
Keywords / Palabras Clave: Indigenous peoples; Higher education participation; Educational inequality; Education policy; Belize
Introduction
Higher Education is often seen as a vehicle for personal realization, for overcoming social and economic inequality, contributing to greater understanding across cultures, building human capital, and producing knowledge and innovation for human and economic development. The United Nations Educational, Scientific and Cultural Organization (UNESCO) (2022) sums it up as a “rich cultural and scientific asset for personal development as well as economic, technological and social change”. The challenge is to ensure that higher education is accessible to those beyond the mainstream economic and cultural capital, otherwise it runs the risk of perpetuating socio-economic inequality (Lynton et al., 1983), and suffering from epistemic poverty: marked by arid landscapes of imagination and path-dependent economic, technological, and social change. Unfortunately, though there has been an increase in mass higher education, significant disparities exist globally, disfavouring those of low socio-economic classes and marginalizing groups that already struggle with systemic exclusion, among them Indigenous peoples (UNESCO, 2022).
The reality of Indigenous peoples in higher education in Belize seems to be consistent with global trends (UNESCO, 2022; Ilie et al., 2021). The 2022 census reports that among the Indigenous Maya only 5.6% have a completed higher education degree compared to 14% of the national population, while the Garifuna, another Indigenous group, seems to be an exception with 20 percent of all Garifuna people having completed a tertiary level degree. Here, we want to examine the Belize case closer.
The Belizean Context
Belize is a small country on the Caribbean coast of Central America next to Guatemala and Mexico. Spatially it is the second smallest country in the region, with a total area of approximately 8,867 square miles. Demographically it is the smallest country in Latin America with a population of approximately 397,483 inhabitants (Statistical Institute of Belize [SIB], 2024a). This population spread over six administrative districts is largely rural (57.8% vs. 42.2% urban). The population is young with a median age of 25 in 2022, and 27.6% under 14 years of age. Gender wise the population composition was 49.2% males and 50.8% females (SIB, 2024a).
While part of Central America, Belize is distinct. In contrast to the rest of the Central American countries, it was a British colony, it is English speaking, is part of the British Commonwealth, and a member of the Caribbean Community (CARICOM). Belize which is often referred to as a Caribbean country in Central America shares much in common with English-speaking Caribbean countries, including its education system, a Westminster parliamentary democracy, the figure of a governor general that represents the British monarch and a prime minister instead of a president. In contrast to the rest of the region, it was spared the conflicts of the latter part of the 20th Century and maintains a relatively stable political and governance situation.
Belize is culturally and linguistically diverse. Its population consists of: Mestizo/Hispanic/Latino (51%), Creole (25.2%), Maya [Q’eqchi, Mopan, Yucatec] (9.8%), Garifuna (4%), East Indian (1.5%), and other ethnic groups with smaller population sizes including Mennonites, Chinese, Indians (SIB, 2024a). The official language is English. However, other languages are spoken including Spanish, Creole, Garifuna, Q’eqchi, Mopan, Yucatec, and though this may be changing, English is often the second language of Belizeans.
In terms of human development, Belize is ranked at 118 out of 193 countries (United Nations Development Programme [UNDP], 2025). Compared to the Caribbean countries Belize performs comparatively poorer to Barbados and Guyana, ranking at 69 and 89 respectively (UNDP, 2025). Compared to Central America, Belize does better than Guatemala, Honduras and El Salvador but worse than Panama and Costa Rica (UNDP, 2025). One of Belize’s greatest human development challenges is persistent poverty. In 2000 the poverty rate was assessed at 33% (National Human Development Advisory Committee [NHDAC], 2002), in 2010 at 41.3% (NHDAC, 2010) and in 2018/2019 at 52% (SIB, 2021). Poverty particularly affects rural populations, Indigenous peoples and children under 14. In 2018 rural poverty stood at 59% versus urban poverty at 43% and children under 14 poverty was reported at 60%. By ethnicity, the Maya population reported the highest level of poverty with 77%, though this statistic is heavily influenced by the reality of poverty among the Maya in Toledo at 82%. The other Indigenous group, the Garifuna, report 52%. The Multidimensional Poverty Index (SIB, 2024) reports similar trends; the Maya reported 56.0% followed by Mestizo at 19.2%, Creole 9.8% and Garifuna 12.0% .
The economic forecast of Belize does not look well according to the World Bank and IMF which anticipate the economy to slow down significantly from a growth rate of 15.2% in 2021, and 9.6% in 2023 to 2-3% in the medium term (World Bank, 2025; International Monetary Fund [IMF], 2024). A recent study by Bulmer-Thomas (2025) notes that while Belize has experienced economic growth since the Covid pandemic, in real terms it has fallen behind when compared to other countries in the region. Barring Haiti which is an extreme outlier, it notes that Belize is second to the last when compared to other Caribbean countries. In comparison to its Central American counterparts it has fallen. One very alarming observation of the Bulmer-Thomas study is the growing inequality in Belize; it estimated a Gini coefficient based on non-wage of 0.6.
Belize is burdened by debt (Public debt in 2022 was 72.8 percent of the GDP) suggesting limited resources to invest in human development (UNDP, 2025) with negative consequences for the disadvantaged. The forecasted decline in GDP, growing inequality and lesser resources bodes poorly for the future. A related and startling observation made by Bulmer-Thomas study is that there is a falling per capita productivity in the last 20 years indicating either low investment in fixed capital, poor management or low levels of human capital. The latter is relevant to higher education given its role in building human capital.
Indigenous Peoples of Belize
Belize does not formally recognize Indigenous peoples beyond acknowledging them in the preamble to the constitution in referencing the commitment to policies to protect the “identity, dignity and social and cultural values of Belizeans including Indigenous peoples” (Government of Belize, 2011:15). It does not specify who the Indigenous peoples are, but the Commission of Indigenous Affairs, established in 2021, serves Garifuna and Maya people (Ministry of Human Development, Families and Indigenous Peoples’ Affairs, 2021), thus indirectly recognizing these two groups as Indigenous peoples of Belize. This is consistent with the understanding of the Belize National Indigenous Council established by the Maya and Garifuna. Additionally, a series of Maya land rights court cases has legally affirmed the indigeneity of the Q’eqchi and Mopan Maya people in southern Belize and recognized their rights to land (Conteh, 2007, 2010; Supreme Court, 2016; Caribbean Court of Justice, 2015).
Of Belize’s population, 13% are reported as Indigenous (SIB, 2024), with the Maya representing 9% and the Garifuna (15,845) 4%. The Q’eqchi (26,230) and the Mopan (15,932) predominantly reside in Southern Belize, while the Yucatec (2160) live mainly in the northern districts of Corozal, Orange Walk and Cayo. The statistics on Indigenous populations, however, are often called into question by Indigenous organizations who contend that the numbers are higher. In the last two to three decades however, there has been a level of internal migration resulting in a sizable population of Mopan and Q’eqchi now in the Cayo District (5,001) particularly in the periphery of Belmopan City. The Garifuna on their part are mostly concentrated Southern Belize but also have sizable populations in Belize City, Belmopan and small enclaves in the north.
Overall, the social reality of Belize’s indigenous Garifuna, Yucatec, Q’eqchi, and Mopan Maya, is marked by persistent exclusion and inequality, particularly in rural districts like Toledo, Stann Creek, and Corozal. Despite recent infrastructure improvements, these communities continue to face limited access to electricity, health, and education services, and a high poverty rate which reflect long-standing socio-economic marginalization. The Maya report the lowest levels of higher education. This is worthy of note considering that the level of multidimensional poverty for those without higher education is 36% versus 2.7% for those with a tertiary level education (SIB & UNICEF, 2017). This lag begins at the secondary level. Maya girls, for example, make up a disproportionate share of the out-of-school secondary school population, making up 53.7% of all out-of-school girls at this level. The reality of Indigenous peoples in Belize reflects the trends of exclusion characteristic of Latin America and the Caribbean (UNESCO, 2022).
Education in Belize
Belize’s Education System is organized as pre-primary, primary, secondary, and tertiary. Education (Ministry of Education, Science, Culture and Technology [MOE], 2021). Education is compulsory for ages 5-16 including primary (8 years) and secondary (4 years). Pre-school is not compulsory and coverage is low especially in the rural areas. The enrolment rate is only 38.8%.
Most communities in Belize have a primary school. The net enrolment rate at this level in 2022-2023 was at 84.7%, dropout rate was 5.7%, and repetition rate was 4.6% (Ministry of Education, Science, Culture and Technology, 2023). By districts, Toledo reported the highest dropout rate with 6.5%, followed by Cayo with 6.2% and Belize district with 6.0%. Males reported higher dropout and repetition rates across the board.
Most high schools are in the main urban centres, hence access is more complicated for rural communities reflected in the net enrolment rate of 55.9% in 2023 (Ministry of Education, Science, Culture and Technology, 2023). Repetition rate for the same period at this level was 5.0%. By district the repetition rates were highest in the Belize District with 7.2%, followed by Toledo with 4.7%. In terms of vocational and training education, enrolment was highest in Belize City with 336, followed by Corozal at 159, Cayo with 155 and Stan Creek at 126. The lowest were Toledo with 52 and Orange Walk with 25.
Higher Education in Belize has a relatively recent history. Bachelor degree programs were not offered until the establishment of the University College of Belize in 1986 which was later dissolved and amalgamated along with other institutions into the University of Belize in 2000 (Aird, 2003). The tertiary level education system consists of universities and junior colleges. Junior colleges offer associate-degrees the equivalent of the first two year university equivalent. Universities offer associates, bachelors and master’s degree programs. There are currently no institutions offering doctoral programs. The junior college to university system allows students to complete an associate’s degree at a Junior college and then complete the latter two years of a bachelor’s degree at one of the universities.
There are currently four universities in Belize (Ministry of Education, Science, Culture and Technology, 2021b): The University of Belize (UB), the national university and the largest with its main campus in Belmopan and branches in Belize City, Toledo and Central Farm; Galen University a private university located in Central Farm, Cayo District offering face to face at its campus and online programs with a national reach; St. John’s College University a Jesuit university established in 2024; and the University of the West Indies the regional university of the Caribbean which has a center in Belize City. Additionally there are eleven Junior Colleges distributed across the country: Corozal-3, Orange Walk- 1, Belize- 3, Cayo-2, Stann Creek- 2. The Toledo district does not have a Junior College but the University of Belize (UB) has a campus in the capital town through which it offers a selection of associate degrees.
In terms of attainment, the three censuses of the last 30 years show that there has been an increase in the number of people with higher education, rising from 3.58% in 1996 to 14% in 2022 (SIB). These censuses also indicate that the Garifuna people have consistently been significantly above the national average with 20.2 % in 2022, while the Maya have consistently been on the extreme opposite pole with 5.56% compared to the national average of 14.4%. The Q’eqchi have consistently been the lowest with 0.39% compared to the national average of 8.27% in 2022.
Table 1. Percentage of Population with Higher Education Degree
(from SIB census 1991-2022)
| Census Year | National | Indigenous[6] | Garifuna | Maya Total | Maya Yucatec | Maya Mopan | Maya Q’eqchi |
| 1991 | 3.58 | 6.23% | 3.90% | 2.33% | 1.44% | 0.65% | 0.24% |
| 2000 | 5.39 | 10.82% | 6.45% | 4.37% | 2.75% | 1.23% | 0.39% |
| 2010 | 8.27 | 20.5 | 10.73 | 9.77% | 5.56% | 2.90% | 1.31% |
| 2022 | 14.4 | 20.2% | 20.16 | 5.56% | NA | NA | NA |
Note:
1. The 2022 Census does not disaggregate between Maya linguistic groups.
2. The Indigenous column is our computation. If the Garifuna and Maya data is aggregated as Indigenous peoples, Indigenous peoples seem to be doing well, however it hides the huge disparities between Indigenous groups
This growth is likely due to the increase in access (most junior colleges and universities were established post 2000) and an increase in population. The significantly higher attainment by the Garifuna might be explained by the fact that Garifuna people were recruited as teachers during the early years of education in Belize. Hence, they have a longer trajectory of participating in education.
The net enrolment for higher education in the academic year 2023-2024 was estimated at 16.1% for persons aged 17-21, with females reporting higher levels of participation (MOE, 2024). This is fairly comparable to Belize’s neighbour Mexico, which reflected an enrolment rate of 12.62% for those ages 15-19 and a rate of 23.29 for those ages 20-24 in 2023. A similar comparison can be made to Costa Rica which reflected a net enrolment rate of 5.03 for ages 15-19 and 13.55 for ages 20-24 and in 2023 (Organisation for Economic Co-operation and Development [OECD] Data Explorer, 2025).
Enrolment data in Belize does not disaggregate by ethnicity. However, in 2013 a report noted that Tertiary school attendance by ethnicity broke down in the following manner: Mayan 9.2%, Mestizo 16.2%, Creole 22.5%, and Garifuna 23.2% (Alonzo et al., 2013: 7). These numbers are consistent with the attainment data, showing Garifuna topping the numbers and the Maya performing the poorest.
Overall, the existing data suggest that higher education participation and attainment have been increasing over the past two decades. Disaggregation by ethnicity shows that the rates of attainment vary significantly across groups. The data indicate that Maya groups are lagging behind, with the Q’eqchi, the largest Indigenous group, showing the lowest levels. Considering the importance of Higher education for personal and human development, this raises important questions for addressing the poverty and human development gaps faced by Indigenous peoples such as the Q’eqchi. However, as noted earlier, enrolment data is not disaggregated by ethnicity, and without disaggregated data, it is difficult to ascertain the level of participation of Indigenous peoples. Consequently, without such data and an understanding of the factors that enable or inhibit participation, it is difficult to develop effective strategies to increase participation.
The Indigenous Peoples in Higher Education Project
In 2024, the International Development Research Centre (IDRC) funded research project “Supporting policies and practices for indigenous groups in institutions of higher education and academic research in Central America”[7] provided an opportunity to diagnose the participation of Indigenous peoples in higher education in Belize and contribute to filling the data gaps. The literature review suggested this is the first study of its kind.
The research involved collecting institutional data from tertiary-level education institutions to characterize participation, and data from currently enrolled tertiary-level students to understand the factors affecting participation through an electronic survey and focus-group interviews.[8]
Perhaps the most important revelation from this study is that Belize does not officially nor systematically track ethnic participation at the tertiary level. The Ministry of Education only tracks enrolment by gender and age. The absence of an official tracking system means that most higher education institutions do not track participation by ethnicity and the categories for the Maya population are inconsistent across institutions. Only four education institutions indicated that they collect data on ethnicity, and only The University of Belize provided such data. As the national university, the largest, the one with the widest reach, and the only one with a campus in Toledo (the district with the highest concentration of Indigenous peoples), it is a fair proxy for understanding national enrolment and Indigenous participation.
Findings
- Enrolment:
a. On average enrolment in Higher education increased for everyone over the period 2010-2024 as can be gleaned from Figure 1.
Figure 1. Enrolment Counts over Time: Indigenous vs Non-Indigenous
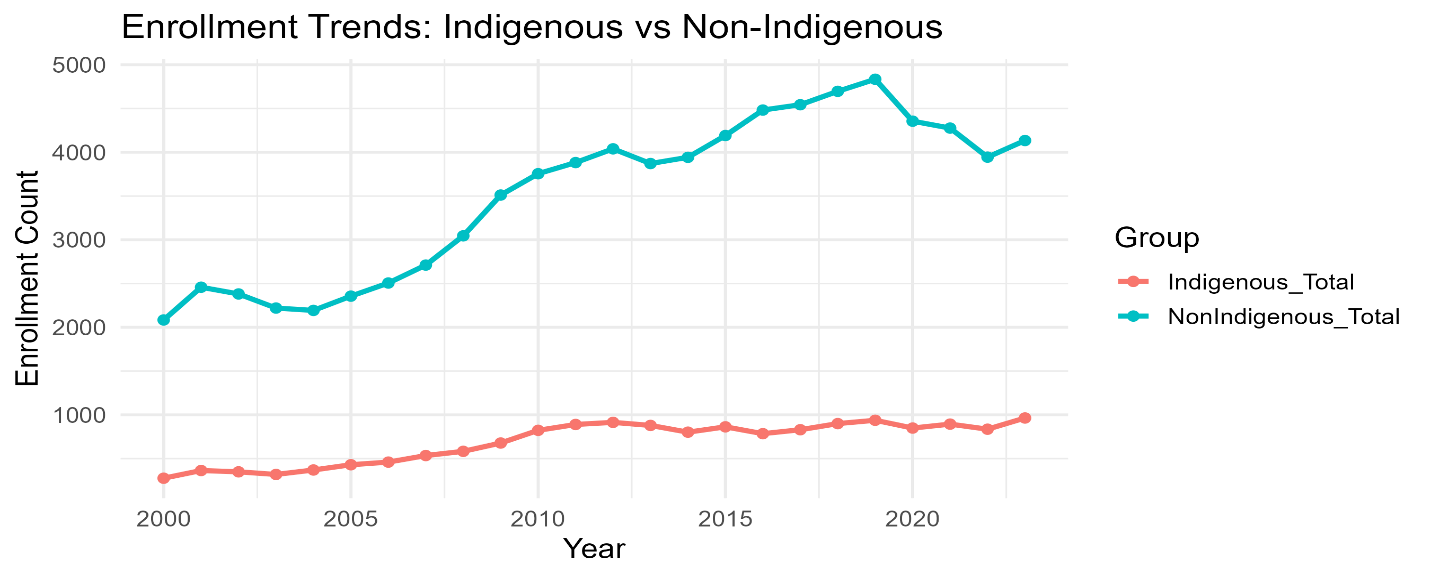
Figure 2. Enrolment Rates over Time. University of Belize: Non-Indigenous vs Specific Indigenous
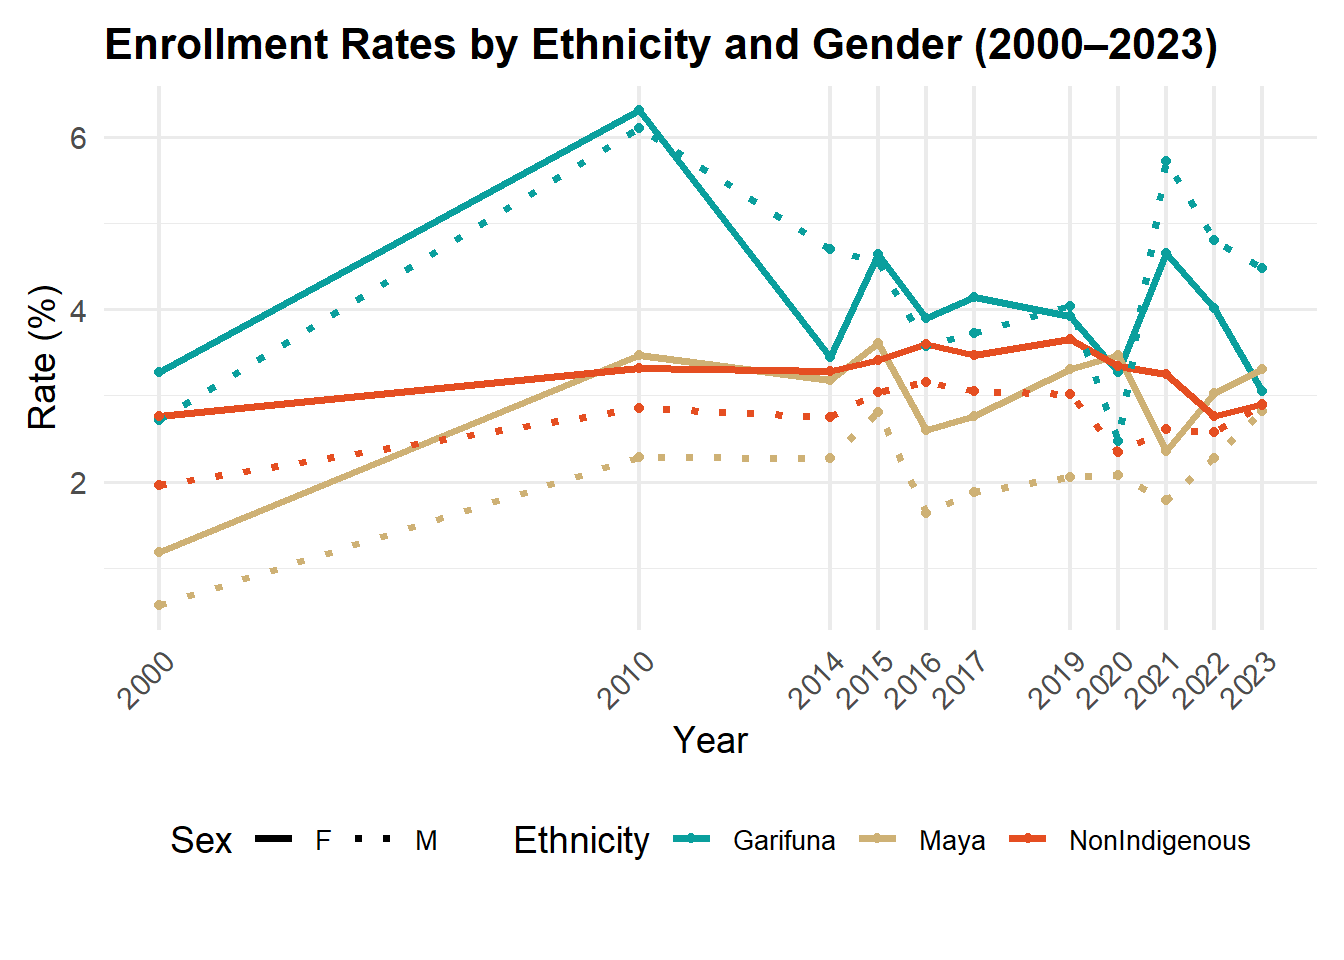
b. The rates of enrolment, however, are not even across groups. Garifuna people have consistently enrolled at higher rates than all other groups, including non-Indigenous. The Maya have consistently shown the lowest rates, except in 2010, 2015, 2022 and 2023. Among the Maya, the Q’eqchi have consistently had the lowest enrolment rates (Figure 3).
c. The rates of enrolment vary over time (Figure 2). While the data for the period (2000-2010) is limited to two data points, it shows that, on average, enrolment rates increased for everyone from 2000 to 2010. They increased sharply for Garifuna and Maya people in comparison to non-Indigenous groups. Between 2010 and 2014, also limited to two data points, the data shows drops for both the Garifuna and Maya with the Garifuna showing a sharp decline while non-Indigenous groups experience slow growth. The period of 2014 to 2019, for there are more data points, shows the ups and downs of enrolment rates of Indigenous peoples year to year. The Garifuna enrolment rates experienced some growth only to decline again in 2020. Maya enrolment rates experienced significant dip in 2015 but closed the period with a recovery. Among the Maya, the Q’eqchi had only marginal growth, the lowest (Figure 3). In contrast, non-Indigenous enrolment rates have shown very low variability throughout (2000 to 2019). Post-Covid (2019 and 2024) on average all groups showed a decline in enrolment rates with the Garifuna showing a spike in enrolment in 2021, but quickly declining while the Maya show a sharp decline but a quick recovery.
Figure 3. Enrolment by Gender and Ethnicity
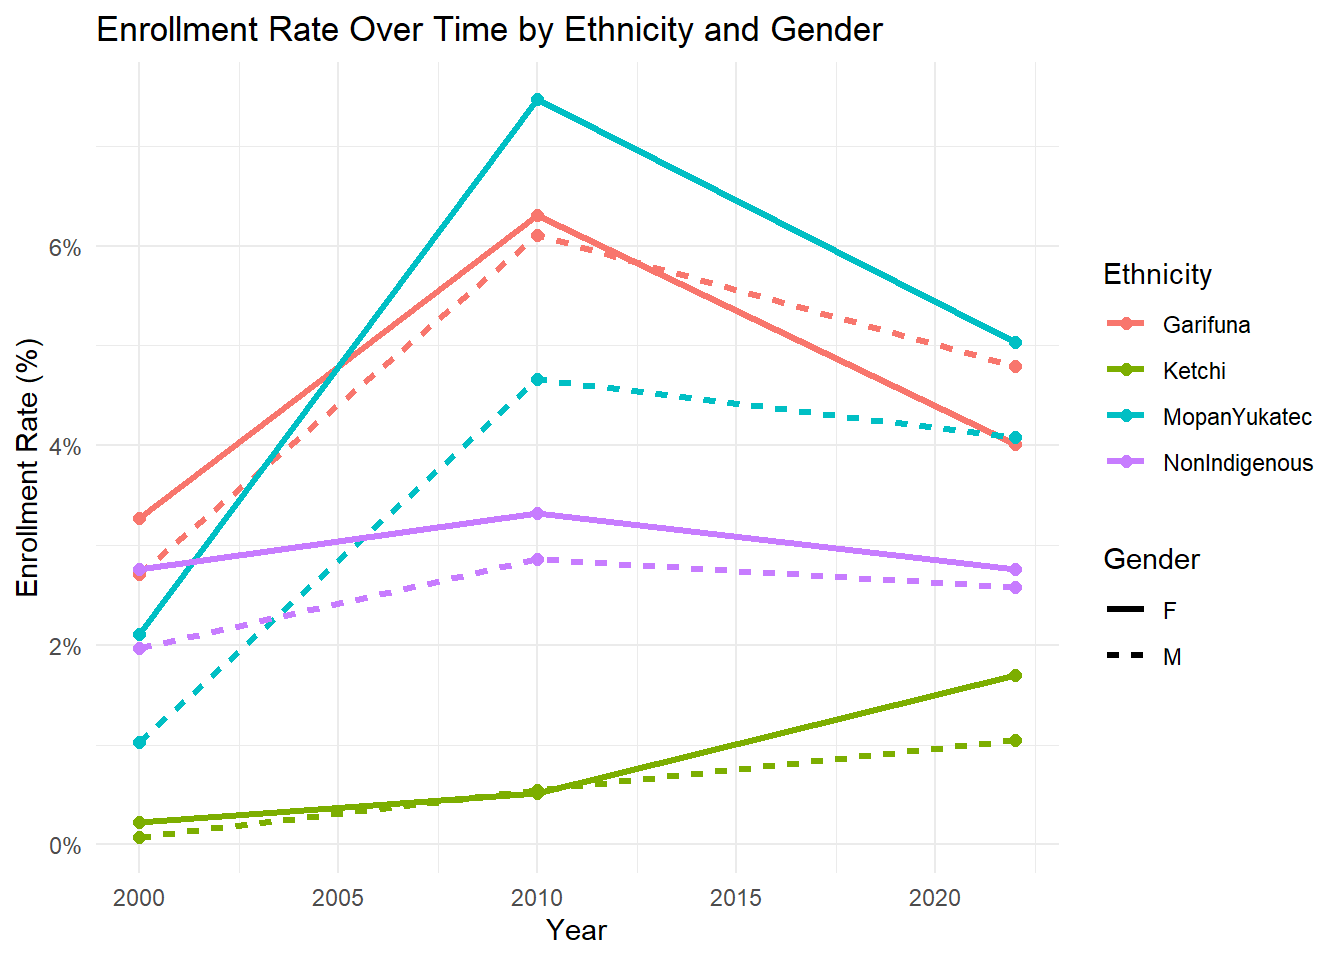
d. Gender-wise, females enrol at higher rates than males across all groups including non-Indigenous (Figure 3). This pattern is most pronounced among the Garifuna, except in the period 2021 to 2023 (Figure 1). The Q’eqchi, on the other hand, show the least differentiation. Overall, these gender gaps highlight ongoing gender-specific challenges in education.
Taken as a whole (Figure 3), after the first spurt of growth for all groups between 2000-2010, enrolment rates declined for everyone up to 2019, except for the Q’eqchi, who show marginal growth with low statistical significance. The Garifuna, who began with the highest enrolment rates, experienced a sharp decline from the early to middle periods, with only a partial recovery later. The Mopan and Yucatec show declines that parallel Garifuna trends. In contrast, non-Indigenous groups experience low variability. In terms of gender, enrolment rates have favoured females across all groups.
- Factors affecting participation
The data from the respondents in the virtual survey offer a glimpse of the factors affecting Indigenous participation. There were 98 participants from multiple higher education institutions ( UB – 60, Galen – 22 and other junior colleges – 8), included 68 females and 20 males. Of these, 32% were Garifuna, 30% Q’eqchi, 29% Mopan, and 7.1% Yucatec. Almost three quarters of the participants were enrolled full-time, and about 40% lived away from home.
The respondents reported a fairly easy enrolment process but identified important challenges once at university. Those living away from home, in order of rank, reported financial challenges, feeling isolated, homesickness, lack of emotional support and difficulty maintaining cultural practices as the main challenges faced.
Slightly over a third (37.8%) reported having considered dropping out. The top reasons for this consideration, in order of frequency, were: difficulty paying fees, health- or stress-related reasons, family responsibilities and work responsibilities. Academic challenges were the third least selected. Economic challenges seem to be the most significant factor, which aligns with the finding that 48% of respondents are either financially responsible for their households (15%) or contribute financially (33 %).
The findings suggest that the economic factors may be the top factor influencing participation, followed by psycho-social challenges, especially for those living away from home.
Implications/Discussion
The overall picture of higher education in Belize shows it has experienced growth in participation, but the rate of growth, on average, has been in decline since 2010. Expansion has been uneven across gender (disfavouring males) and ethnicity (disfavouring the Maya). Garifuna people have shown higher rates of enrolment, but they have experienced the greatest decline particularly affecting males. Q’eqchi people have consistently been under-represented and show the least growth in enrolment rates. Almost half of Indigenous students attending university live away from home. Slightly over one-third have considered dropping out, and the challenges they face are primarily financial and psycho-social, connected with living away from home. A hugely important finding is that the experiences of Indigenous peoples are varied and interventions would need to respond to these differences.
What explains these contrasts? Why do they matter? What are the implications for Higher Education Policy and practice?
The high levels of enrolment by the Garifuna may be connected to a pattern established in the early history of Belize. The Garifuna were among the first teachers in the country; they were recruited, trained and sent to teach in remote communities. This may have resulted in a strong valuation of education, the establishment of models and, the accumulation of educational cultural capital that benefited younger generations. However, the findings suggest that Garifuna enrolment is experiencing a decline. The implications of this are, firstly, the need to further understand what are the factors behind this decline; secondly, in order for the Garifuna to not loose those gains, interventions that target males in particular may be important.
The low levels of growth in enrolment among the Q’eqchi are likely linked to the high levels of poverty experienced by this group, as well as the spatial and cultural distance of higher education institutions from Q’eqchi communities. This aligns with the principal challenges identified: financial, cultural dislocation, and psycho-social challenges, especially for students living away from home. Unlike the Garifuna, Mopan and Q’eqchi participation in higher education is more recent and consequently they may not have the generational models and accumulated educational cultural capital.
In conclusion, while Belize has experienced expansion in higher education, the rapid increase in enrolment rates culminated in 2010 and turned into decline. Growth has been uneven, disfavouring Maya people and males, and the advantage of the Garifuna has continued to be lost.
Considering Belize’s cultural diversity, its development challenges, its high levels of poverty, its forecasted decreasing economic growth and the low labour productivity levels, there is a clear need for improving the reach and quality of higher education. Higher education is seen, after all, as a vehicle for overcoming social and economic inequality, contributing to greater understanding across cultures, building human capital and achieving greater human and economic development. However, while Belize has experienced expansion of higher education, the initial somewhat blurry picture revealed by this study suggests significant disparities across gender and ethnicities that would prevent higher education from delivering its fruits. The implication is that there is a need for a better tracking system and the development of targeted interventions that respond to the specificities of each group anchored on data if we are to be effective and equitable.
References
Aird, E. (2003, March 17). The Evolution of the Belizean University. Paper presented at the Belize Country Conference, University of the West Indies. https://global.uwi.edu/sites/default/files/bnccde/belize/conference/papers/Aird.html
Alonzo, H., Näslund-Hadley, E., & Martin, D. (2013). Challenges and Opportunities in the Belize Education Sector. (May), 1–43. http://dx.doi.org/10.18235/0009116
Bulmer-Thomas, V. (2025). The Belizean economy in the 21st Century: When and why Belize fell behind and what to do about it. Belize Policy Research Institute.
Caribbean Court of Justice (2015). Consent Order (pp. 10811–10814). pp. 10811–10814.
Conteh, A. (2010). IN THE SUPREME COURT OF BELIZE , A . D . 2010 CLAIM NO . 366 OF 2008 BETWEEN : AND BEFORE the Honourable Abdulai Conteh , Chief Justice . Ms . Antoinette Moore SC for the claimants . Ms . Lois Young SC for the defendants . Mr . Rodwell Williams SC.
Government of Belize (2011). Belize Constitution Act Chapter 4 (Revised Edition).
Ilie, S., Rose, P., & Vignoles, A. (2021). Understanding higher education access: Inequalities and early learning in low and lower-middle-income countries. British Educational Research Journal, 47(5), 1237–1258. https://doi.org/10.1002/berj.3723
International Monetary Fund. Western Hemisphere Dept. (2024). Belize: 2024 Article IV consultation—Press release; and staff report (IMF Staff Country Report No. 2024/124). International Monetary Fund. https://doi.org/10.5089/9798400276248.002
Lynton, E. A., Hoy, J. C., & Bernstein, M. H. (1983). The Economic Impact of Higher Education. In The Journal of Higher Education (Vol. 54). https://doi.org/10.2307/1981938
Ministry of Education, Culture, Science and Technology (2012). Abstract of education statistics 2011–2012. https://www.moecst.gov.bz/wp-content/uploads/2021/08/Abstract-of-Education-Statistics-2011-2012.pdf
Ministry of Education, Science, Culture and Technology (2021a). Belize Education Sector Plan 2021-2025. Government of Belize, Ministry of Education, Science, Culture and Technology.
Ministry of Education, Science, Culture and Technology (2023). Abstract of Statistics 2022-23. Government of Belize, Ministry of Education, Science, Culture and Technology.
Ministry of Education, Culture, Science and Technology (2024). Abstract of education statistics 2023–2024. https://www.moecst.gov.bz/wp-content/uploads/2025/01/Abstract-of-Education-Statistics-2023-2024.pdf
Ministry of Human Development, Families and Indigenous Peoples’ Affairs (2021). Annual Technical Report.
National Human Development Advisory Committee (2010). Country Poverty Assessment 2009 (User Friendly Version). https://doi.org/10.1016/S0022-3913(12)00047-9
National Human Development Advisory Committee (2002). Poverty Assessment Report 2002.
Organisation for Economic Co-operation and Development (2025). OECD Data Explorer [Data set]. https://www.oecd.org/en/data/datasets/oecd-DE.html
Statistical Institute of Belize (2021, June 30). Poverty study 2018/19 [Report]. https://www.sib.org.bz/statistics
Statistical Institute of Belize (2024a, April 8). 2022 population and housing census: Key findings [PowerPoint presentation]. Government of Belize. https://sib.org.bz/wp-content/uploads/CensusLaunch2022.pdf
Statistical Institute of Belize (2024b). Multidimensional Poverty Index (MPI). https://sib.org.bz/wp-content/uploads/MPI_2024-09.pdf
Supreme Court of Belize (2016). Claim No 190 of 2016.
UNESCO (2022). Higher education figures at a glance. UNESCO World Higher Education Conference 2022, 6. https://uis.unesco.org/sites/default/files/documents/f_unesco1015_brochure_web_en.pdf
United Nations Development Programme (2025). Human Development Report 2025 statistical annex: Human Development Index and its components. https://hdr.undp.org/sites/default/files/2025_HDR/HDR25_Statistical_Annex_HDI_Table.pdf
World Bank (2025). Belize country overview. https://www.worldbank.org/en/country/belize/overview
- Correo electrónico: fpenados@galen.edu.bz ↑
- Correo electrónico: lyrosado@galen.edu.bz ↑
- Correo electrónico: delmer.tzib@ub.edu.bz ↑
- Correo electrónico: joyleeshi@sjc.bz ↑
- Correo electrónico: rundin12@gmail.com ↑
- Maya and Garifuna people. ↑
- The project aims to advance policies and practices that promote the inclusion of indigenous people, particularly women, in universities and other academic research spaces in Costa Rica, Guatemala, and Belize. ↑
-
Here draw on the institutional data and the digital survey only. ↑